
Snap to Trails

The Snap to Trails service accepts a route as a series of points and returns a similar set of data with points snapped to the trails hiked along the route. The service can return an interpolated route that includes all of the points forming the full-trail geometry, the trail names hiked, the percentage of each trail hiked, time, distance, elevation, and the energy expended on each trail. Which map would you trust?
Problem
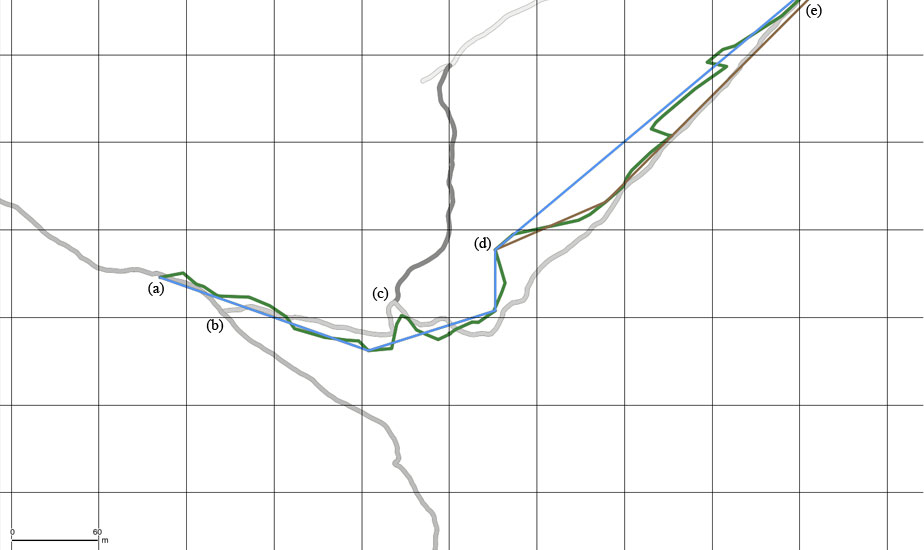
Figure 1 illustrates four different trails in shades of grey plot over a 60 meter grid in GIS with a route in green. The route was simplified using two different tolerance levels represented in blue and brown.
To acquire the route data, I affixed a GPS patch antenna to my wrist and hiked down two of the trails from (a) to (e) while collecting geofenced data in the same way a wearable device collects a route. The route was not processed or corrected using an augmentation system. Notice the inaccuracies in the route compared to the true location of the trails. The route at (d) is ~30 meters away from the trail; this is likely multipath. These inaccuracies are not anomalies, they are recorded by every GPS tracking wearable device, especially at remote locations where GPS provides the only signal for approximating location and where overhead obstructions and large objects such as canyon walls, trees and boulders exist.
[Figure 1]
Some sport tracking apps smooth points or reduce the number of points in routes before depicting them on a map to minimize the visible errors and inaccuracies. This may be accomplished with a Bezier curve algorithm or a DP line simplification algorithm that removes redundant points determined by a tolerance, or distance, in a curve approximated by a series of points.
In Figure 1, the green route is denoted with ~50 geofenced points. The simplified routes (blue and brown) are denoted with less than ten points, making the inaccuracies less noticeable. While the simplified routes may appear to approximately represent the journey, metrics based on any of the route data—simplified or not—is false. As an example, the length of the route (green) between (a) and (e) is 577 meters, the length of the first simplified route (blue) is 497 meters, and the length of the second simplified route (brown) is 505 meters. But the length of the trails actually hiked between (a) and (e) is 537 meters. As another example, if we use an Elevation API to determine the elevation on the route at (d) then the returned elevation will represent a geographic position that was not hiked; the elevation at (d) is 30 horizontal meters from the trail location that was actually hiked and 50 vertical meters lower than the trail location that was actually hiked.
The above problem is amplified when attempting to compare multiple routes on the same trail(s). It is not possible to accurately compare metrics for multiple routes on the same trail(s) using uncorrected route data because each route includes unique errors due to many different variables including satellite geometry, how each wearable device is carried, proximity to reflective surfaces at the time of record and more. This is why many sport tracking leaderboards describe only start and finish times for each competitor; they are the easiest determinable metric with the least possibility of error: simply subtract the start time from the finish time to determine the total time. Sort the total times and a leaderboard exists. Boring. Did each competitor start and finish within n-meters of the same location? Did each competitor follow the same, exact route? Did any competitor cheat by taking short-cuts? These are basic questions that most leaderboards can not answer. Does the #1 person hike with greater velocity on greater gradients? Where exactly did #2 begin to fall behind? How many calories has #1 expended compared to #2, after hiking one kilometer of the trail? This is information that can help competitors improve, and the Trails API provides the necessary data to answer these questions.
Solution
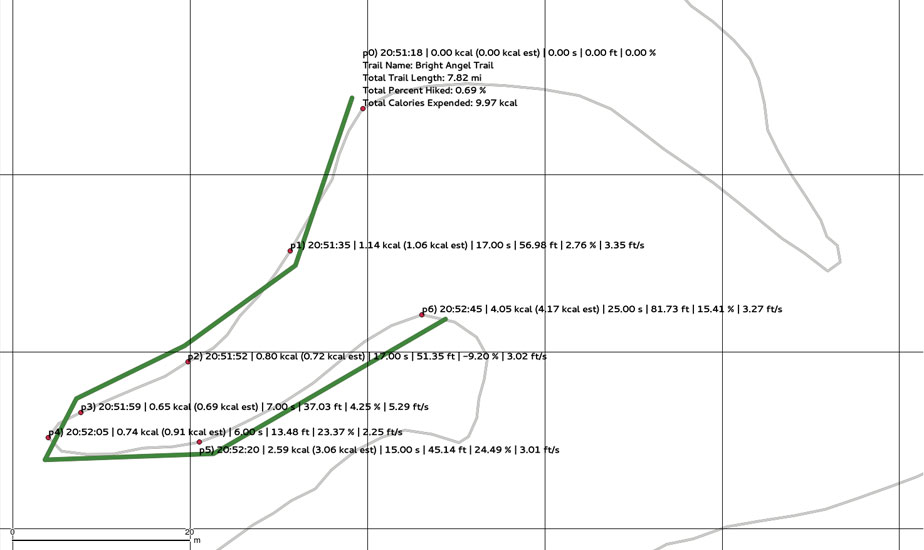
The Snap to Trails service is the solution. The service accepts route data as a points parameter and its response can include corrected points with metadata that describe each point and metrics between adjoining points. Figure 2 is an example of a route (green) that was passed to the service with the gross weight of the hiker.
[Figure 2]
The service found a match with a trail (grey) and corrected the route points (red). At each point, the service determined the time and distance (speed), elevation, and energy expended while hiking. The service returns all of this data with a list of the trail names hiked and the percentage of each trail hiked. Metrics are based on the points along the trail, where the hiking occurred, not the inaccurate route recorded by the wearable device. This means that the metrics on multiple routes along the same trail are all based on the same terrain. The service can return an interpolated route that includes all of the points forming the full-trail geometry along the route, in addition to the trail names hiked, the percentage of each trail hiked, and other metrics.
Summary
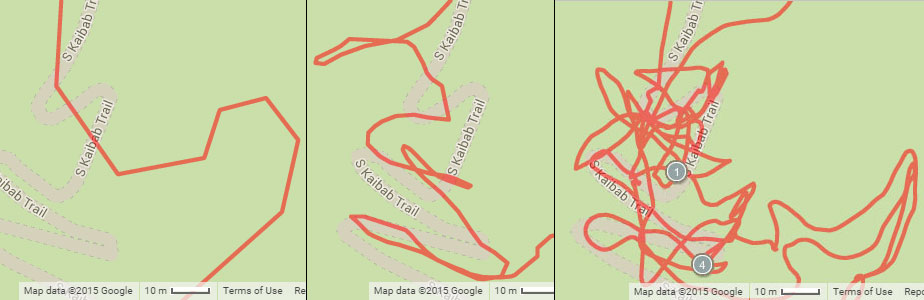
Figure 3 illustrates three maps with routes on the same trail, hiked by three different athletes, as they are depicted on various sport tracking websites. All three athletes hiked on the trail. Hiking off-trail at this location is not possible. Each route is uniquely inaccurate. The three web pages displaying these maps include metrics which are also inaccurate because they are based on inaccurate route data.
[Figure 3]
After the route is passed to the Snap to Trails service, an accurate route that follows the trail is returned, as illustrated in Figure 4. Each point is paired with timestamps and metrics that describe the journey. With the Trails API, sport tracking websites can accurately depict routes on maps with the names of trails hiked, the percentage of each trail hiked and other metrics.

[Figure 4]